
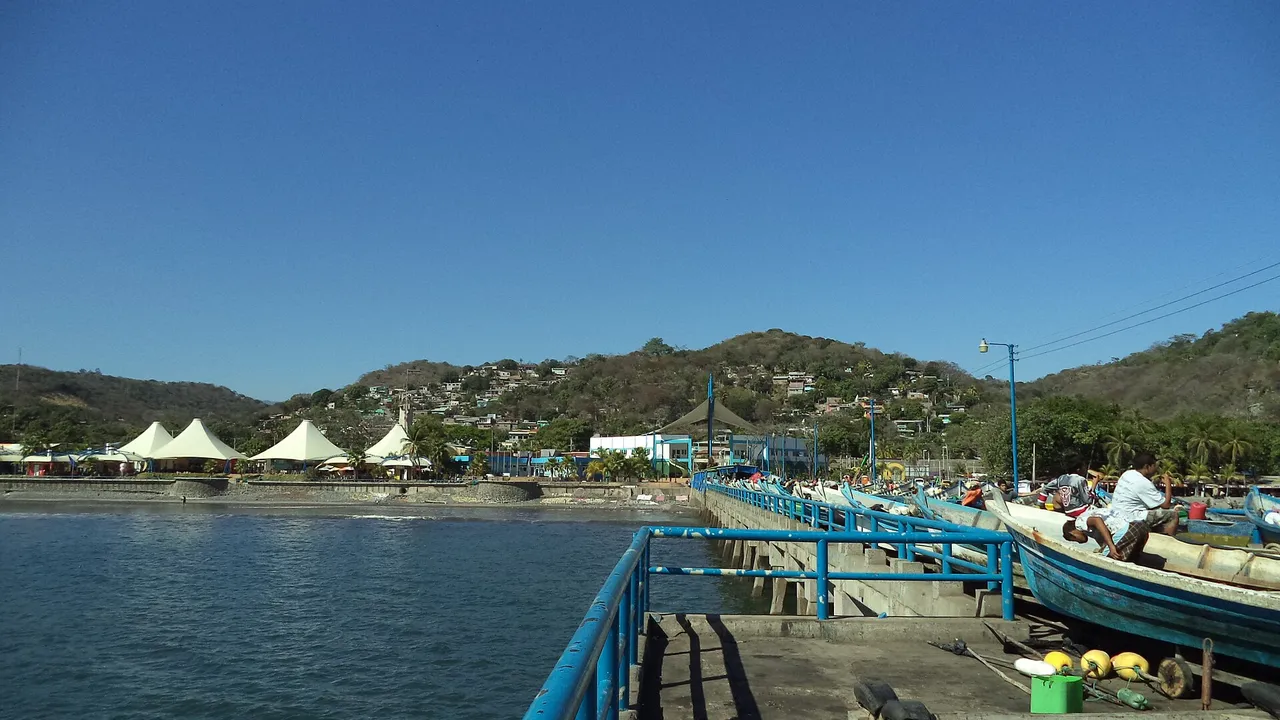
Invest in La Libertad, El Salvador
At a glance
| La Libertad | |
|---|---|
| District | La Libertad |
| Municipality | La Libertad Costa |
| Department | La Libertad |
| Population of the district, 2024 | 44,761 |
| Urban population | 71.5% |
| Population of the municipality, 2024 | 85,917 |
| Area of the municipality | 441.0 km² |
| Districts in the municipality | Chiltiupán, Jicalapa, La Libertad, Tamanique, Teotepeque |
Source: BCR and ONEC: VII Population Census 2024, population by department, municipality and district, urban and rural (Excel, in Spanish); UNDP: socio-economic map, guide to the 44 new municipalities of El Salvador, October 2024 (PDF, in Spanish); Legislative Assembly: Decree 762, the Special Law for the Territorial Restructuring of El Salvador1,2,3
Map of La Libertad Costa
Living and working
The household survey figures are published for the municipality of La Libertad Costa, not for each district.
| Indicator, 2023 | La Libertad Costa | Rank among the 44 municipalities |
|---|---|---|
| Average monthly labour income | $393.05 | 9 of 44 |
| Employment rate | 62.4% | |
| Workers in informal jobs | 76.3% | |
| Households with internet | 24.3% | |
| Households receiving remittances | 25.4% | |
| Households in monetary poverty | 26.7% | |
| Average years of schooling | 6.0 |
Source: UNDP: socio-economic map, guide to the 44 new municipalities of El Salvador, October 2024 (PDF, in Spanish)2
Economy and investment
- Surf City: the Ministry of Tourism programme covers beaches such as El Tunco and the port of La Libertad.
Source: Ministry of Tourism: Surf City programme4
Sources
- BCR and ONEC: VII Population Census 2024, population by department, municipality and district, urban and rural (Excel, in Spanish)
- UNDP: socio-economic map, guide to the 44 new municipalities of El Salvador, October 2024 (PDF, in Spanish)
- Legislative Assembly: Decree 762, the Special Law for the Territorial Restructuring of El Salvador (in Spanish)
- Ministry of Tourism: Surf City programme (in Spanish)
Figures checked 9 November 2026. Prepared by InvestSalvador.com for general information. Figures come from the sources listed.