
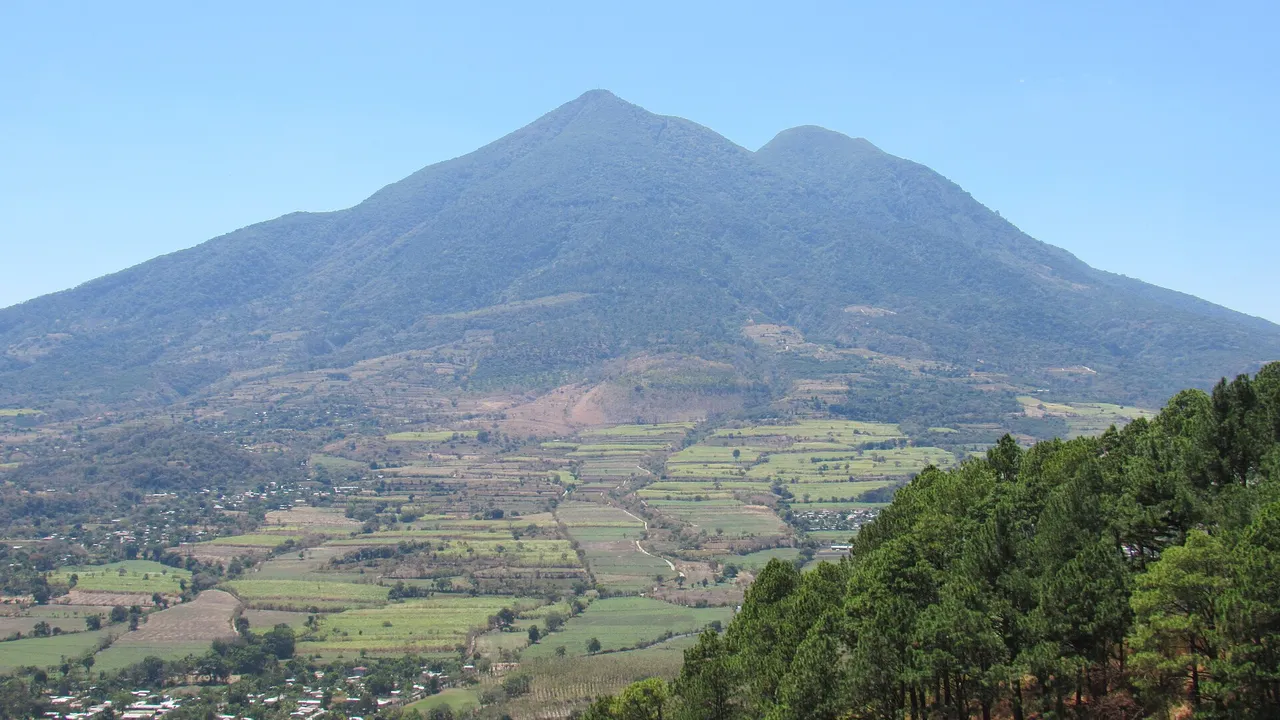
Invest in San Vicente, El Salvador
At a glance
| San Vicente | |
|---|---|
| Capital (cabecera) | San Vicente |
| Population, 2024 | 161,857 |
| Rank by population | 13 of 14 |
| Urban population | 99,385 (61.4%) |
| Land area | 1,184 km² |
| People per km² | 137 |
| Municipalities | 2 |
| Districts | 13 |
Source: BCR and ONEC: VII Population Census 2024, population by department, municipality and district, urban and rural (Excel, in Spanish); UNDP: socio-economic map, guide to the 44 new municipalities of El Salvador, October 2024 (PDF, in Spanish)1,3
Land area is the sum of the municipal areas published by UNDP; density is an InvestSalvador.com calculation from that area and the census.
Map of San Vicente
Municipalities and districts
Decree 762 merged the 262 old municipalities into 44 from 1 May 2024. The old municipalities became districts. San Vicente has 2 municipalities:4
| Municipality | Population 2024 | Urban | Area, km² | People per km² | Average labour income, 2023 | Employment rate, 2023 |
|---|---|---|---|---|---|---|
| San Vicente Sur | 99,244 | 73.6% | 627.5 | 158 | $289.02 | 63.5% |
| San Vicente Norte | 62,613 | 42.1% | 556.5 | 113 | $287.09 | 55.2% |
Source: BCR and ONEC: VII Population Census 2024, population by department, municipality and district, urban and rural (Excel, in Spanish); UNDP: socio-economic map, guide to the 44 new municipalities of El Salvador, October 2024 (PDF, in Spanish)1,3
- San Vicente Sur (6 districts): San Vicente, Guadalupe, Verapaz, Tepetitán, Tecoluca, San Cayetano Istepeque
- San Vicente Norte (7 districts): Apastepeque, Santa Clara, San Ildefonso, San Esteban Catarina, San Sebastián, San Lorenzo, Santo Domingo
Source: Legislative Assembly: Decree 762, the Special Law for the Territorial Restructuring of El Salvador4
Population and urban share: 2024 census. Area, labour income (average per worker, a month) and employment rate: UNDP, from the 2023 household survey (EHPM).
Largest districts
Source: BCR and ONEC: VII Population Census 2024, population by department, municipality and district, urban and rural (Excel, in Spanish)1
Economy and investment
- 15 de Septiembre: the CEL hydro plant on the Lempa, between San Ildefonso (San Vicente Norte) and Estanzuelas (Usulután Norte), has 180 MW and has run since 1983.
- Population: 2.7% of the people of El Salvador, in 13 districts.
Source: CEL: contact details and locations of the hydroelectric plants; CEL: audited financial statements 2024, with the capacity of each plant (PDF, in Spanish); BCR: results of the VII Population Census and VI Housing Census, 31 October 2024; BCR and ONEC: VII Population Census 2024, population by department, municipality and district, urban and rural (Excel, in Spanish)5,6,2,1
Sources
- BCR and ONEC: VII Population Census 2024, population by department, municipality and district, urban and rural (Excel, in Spanish)
- BCR: results of the VII Population Census and VI Housing Census, 31 October 2024 (in Spanish)
- UNDP: socio-economic map, guide to the 44 new municipalities of El Salvador, October 2024 (PDF, in Spanish)
- Legislative Assembly: Decree 762, the Special Law for the Territorial Restructuring of El Salvador (in Spanish)
- CEL: contact details and locations of the hydroelectric plants (in Spanish)
- CEL: audited financial statements 2024, with the capacity of each plant (PDF, in Spanish)
Figures checked 9 November 2026. Prepared by InvestSalvador.com for general information. Figures come from the sources listed.