
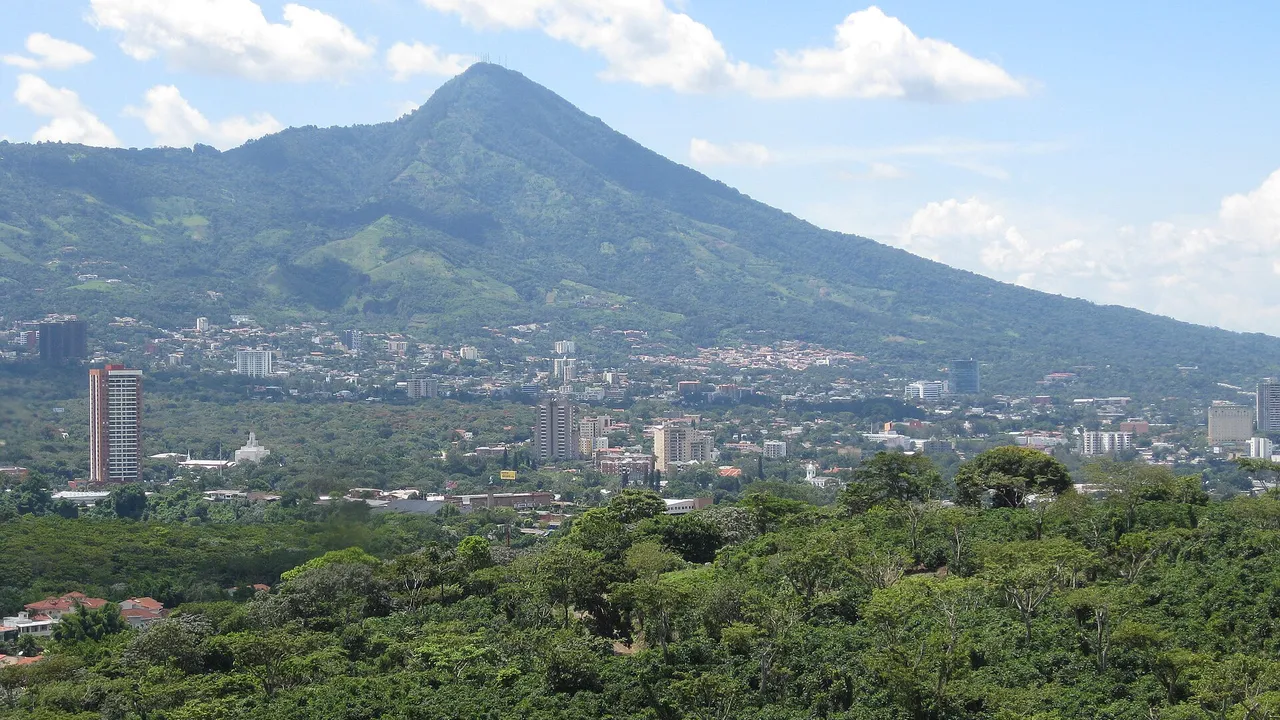
Invest in San Salvador, El Salvador
At a glance
| San Salvador | |
|---|---|
| Capital (cabecera) | San Salvador |
| Population, 2024 | 1,563,371 |
| Rank by population | 1 of 14 |
| Urban population | 1,509,226 (96.5%) |
| Land area | 886 km² |
| People per km² | 1,764 |
| Municipalities | 5 |
| Districts | 19 |
Source: BCR and ONEC: VII Population Census 2024, population by department, municipality and district, urban and rural (Excel, in Spanish); UNDP: socio-economic map, guide to the 44 new municipalities of El Salvador, October 2024 (PDF, in Spanish)1,3
Land area is the sum of the municipal areas published by UNDP; density is an InvestSalvador.com calculation from that area and the census.
Map of San Salvador
Municipalities and districts
Decree 762 merged the 262 old municipalities into 44 from 1 May 2024. The old municipalities became districts. San Salvador has 5 municipalities:4
| Municipality | Population 2024 | Urban | Area, km² | People per km² | Average labour income, 2023 | Employment rate, 2023 |
|---|---|---|---|---|---|---|
| San Salvador Centro | 673,319 | 99.7% | 141.6 | 4,755 | $512.12 | 61.5% |
| San Salvador Este | 496,761 | 98.2% | 187.7 | 2,646 | $452.59 | 63.0% |
| San Salvador Sur | 166,671 | 92.5% | 198.8 | 839 | $428.99 | 63.5% |
| San Salvador Oeste | 164,756 | 93.7% | 135.2 | 1,219 | $400.87 | 66.3% |
| San Salvador Norte | 61,864 | 67.2% | 222.9 | 278 | $353.63 | 63.7% |
Source: BCR and ONEC: VII Population Census 2024, population by department, municipality and district, urban and rural (Excel, in Spanish); UNDP: socio-economic map, guide to the 44 new municipalities of El Salvador, October 2024 (PDF, in Spanish)1,3
- San Salvador Centro (5 districts): Ayutuxtepeque, Mejicanos, San Salvador, Cuscatancingo, Ciudad Delgado
- San Salvador Este (4 districts): Ilopango, San Martín, Soyapango, Tonacatepeque
- San Salvador Sur (5 districts): Panchimalco, Rosario de Mora, San Marcos, Santo Tomás, Santiago Texacuangos
- San Salvador Oeste (2 districts): Apopa, Nejapa
- San Salvador Norte (3 districts): Aguilares, El Paisnal, Guazapa
Source: Legislative Assembly: Decree 762, the Special Law for the Territorial Restructuring of El Salvador4
Population and urban share: 2024 census. Area, labour income (average per worker, a month) and employment rate: UNDP, from the 2023 household survey (EHPM).
Largest districts
Source: BCR and ONEC: VII Population Census 2024, population by department, municipality and district, urban and rural (Excel, in Spanish)1
Economy and investment
- Population: 26.4% of the people counted by department live here. Five of the ten largest districts are in the department: San Salvador (330,543), Soyapango (230,255), Mejicanos (136,641), Apopa (129,083) and Ciudad Delgado (106,367).
- Public works: the 2026 budget policy includes the restoration of the historic centre of San Salvador and the Apopa bypass, north of the capital.
Source: BCR: results of the VII Population Census and VI Housing Census, 31 October 2024; BCR and ONEC: VII Population Census 2024, population by department, municipality and district, urban and rural (Excel, in Spanish); Ministry of Finance: Budget Policy 2026 (PDF, in Spanish)2,1,6
Free zones
- San Marcos, free zone, San Marcos (San Salvador Sur)
- San Bartolo, free zone, Ilopango (San Salvador Este)
- Santo Tomás, free zone, Santo Tomás (San Salvador Sur)
Source: CAMTEX: free zones and industrial parks5
The free zones map shows every zone in the country, including the new zones authorised or under construction.
Sources
- BCR and ONEC: VII Population Census 2024, population by department, municipality and district, urban and rural (Excel, in Spanish)
- BCR: results of the VII Population Census and VI Housing Census, 31 October 2024 (in Spanish)
- UNDP: socio-economic map, guide to the 44 new municipalities of El Salvador, October 2024 (PDF, in Spanish)
- Legislative Assembly: Decree 762, the Special Law for the Territorial Restructuring of El Salvador (in Spanish)
- CAMTEX: free zones and industrial parks (in Spanish)
- Ministry of Finance: Budget Policy 2026 (PDF, in Spanish)
Figures checked 9 November 2026. Prepared by InvestSalvador.com for general information. Figures come from the sources listed.